
YOLO11n ran 1.83× faster in serial replay with TensorRT than with PyTorch FP32 on our Jetson Orin Nano 8GB. In live runs receiving about 20 camera frames per second, TensorRT recorded a median per-run p99 decision latency of 39.63 ms, compared with 98.82 ms for PyTorch FP32. Processed FPS alone largely hid that difference.
These tests on Turing Pi 2.5 compare runtime performance, queue freshness, supporting-service placement and one hour of camera operation. The useful question is how quickly a complete application produces a decision, not just how quickly the GPU runs the model.
The Dev Kit versus Turing Pi comparison covers carrier choices, while our ROS 2 article measures transport after detections are published. Here, timing starts when the application receives a complete compressed frame and ends when detections are readable on the CPU. Camera exposure and earlier sensor, USB and driver delays are outside that boundary.
Part 1: Test setup and measurement boundaries
The Jetson Orin Nano 8GB module ran on Turing Pi 2.5 with Ubuntu 24.04, Jetson Linux R39.2.1 and JetPack 7.2.1. The software stack used PyTorch 2.14.0+cu132, torchvision 0.29.0+cu132, TensorRT 10.16.2.10, Ultralytics 8.4.183 and OpenCV 4.6.0. NVMe on the Jetson held the benchmark data.
A Logitech Brio 100 supplied 1280 × 720 MJPEG. It enumerated behind a USB 2.0 hub at 480 Mb/s; the physical board connector and BMC route were not independently traced. The requested 30 FPS mode negotiated successfully, with automatic exposure, automatic white balance and exposure-driven frame-rate control enabled. Actual arrivals varied between about 20 and 30 FPS. The recordings do not establish why each run settled at its observed rate.
YOLO11n used batch one and a fixed 1 × 3 × 640 × 640 RGB input. The application decoded JPEGs on the CPU through OpenCV, then used the same resize, padding and normalization across runtimes. All three paths used external non-maximum suppression (NMS), which removes overlapping detections, with confidence 0.25, NMS IoU 0.70 and at most 300 detections.
TensorRT (FP16 enabled) means an engine exported through Ultralytics with static 640 × 640 input, batch one, FP16 enabled and NMS kept outside the engine. Its input and output bindings were FP32; layer-by-layer precision was not measured. OpenCV and PyTorch intra-op and inter-op thread counts were set to one. PyTorch TF32 was disabled for CUDA matrix multiplication and cuDNN; the TensorRT build did not explicitly set its TF32 flag. Each run warmed up for at least 200 frames and 30 seconds.
A preflight check before the service-placement tests read back the 25 W power profile, ID 1. Clocks were not forced. This records a configured profile, not measured power consumption or independently verified Standard versus Super platform capability.
| Measurement | Boundary |
| GPU inference time | CUDA events around backend execution on its stream |
| Serial replay FPS | File read through completed processing, with one frame in flight |
| Live processed FPS | Completed decisions per second, including frames with no person detection |
| Camera input FPS | Unique valid frames offered to the application queue per second |
| Receipt-to-decision latency | Complete compressed-frame receipt through CPU-readable detections |
Application discards are queue-policy drops divided by all unique valid frames offered to that queue, including rejected arrivals. Driver sequence gaps and processing errors are counted separately. Queued frames were drained or otherwise accounted for after input stopped.
Unless stated otherwise, tables report medians of per-run results with minimum-to-maximum ranges in brackets. A p99 is the latency below which 99% of the measured decisions fell; reported p99 medians are not pooled percentiles. Ranges describe observed variation, not confidence intervals.
Part 2: YOLO11n on PyTorch versus TensorRT
Serial replay: TensorRT delivers 1.83× the throughput
Each backend completed three runs of 10,000 frames. The same ordered corpus of 1,791 sampled JPEGs from a roughly two-minute camera session repeated until the target was reached. That is about 15 saved frames per second, not a measurement of the camera’s arrival rate. The capture tool decoded camera frames and re-encoded selected frames as JPEGs at quality 95, so replay used sampled, re-encoded images rather than the original compressed camera buffers. Runs were unpaced, with one frame in flight. Wall time included file reads, decoding, preprocessing, inference, NMS and box restoration.
| Runtime | Replay FPS | GPU inference p50, ms | GPU inference p99, ms |
| PyTorch FP32 | 20.42 [20.31–21.11] | 27.21 [26.87–27.25] | 28.09 [27.64–28.16] |
| PyTorch FP16 | 20.27 [20.23–20.55] | 30.66 [30.34–30.77] | 31.69 [31.31–31.82] |
| TensorRT (FP16 enabled) | 37.35 [37.35–37.80] | 7.99 [7.99–8.01] | 8.01 [8.00–9.41] |
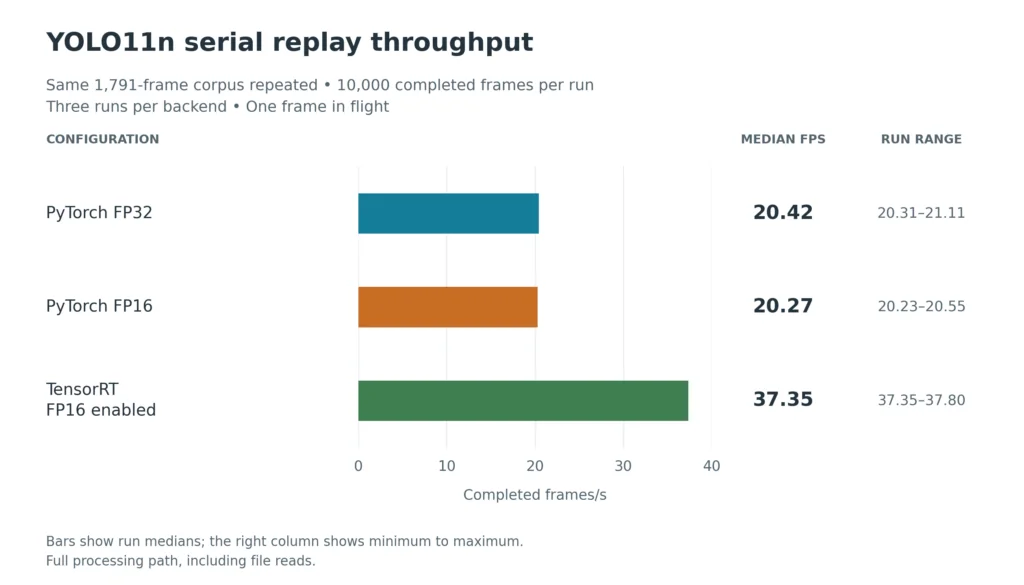
TensorRT reached 37.35 FPS versus 20.42 FPS for PyTorch FP32. This is full-path single-stream replay throughput, not maximum pipelined throughput or an inference-only FPS result.
PyTorch FP16 offered no throughput gain here: its replay median was 20.27 FPS and its GPU event time was higher than FP32. The tests did not isolate the cause. Changing precision alone should therefore not be assumed to improve this particular pipeline.
Live camera: latency matters even when FPS looks similar
All nine live runs completed 10,000 decisions during their timed windows, lasting about 498–517 seconds each. The table separates the observed input rates after measurement so that the faster-input PyTorch runs do not disappear inside one median. Every valid run remains included. These are descriptive groups, not newly controlled input-rate trials.
| Runtime | Runs | Camera input FPS | Processed FPS | Receipt-to-decision p99, ms | Application discards, % |
| PyTorch FP32 | 2 | 19.94 [19.93–19.94] | 19.81 [19.74–19.88] | 98.82 [98.19–99.45] | 0.62 [0.28–0.96] |
| PyTorch FP16 | 2 | 19.93 [19.93–19.93] | 19.74 [19.73–19.75] | 100.36 [100.35–100.37] | 0.98 [0.92–1.04] |
| TensorRT (FP16 enabled) | 3 | 19.93 [19.84–19.93] | 19.93 [19.84–19.93] | 39.63 [39.52–40.40] | 0.00 [0.00–0.00] |
| PyTorch FP32 | 1 | 29.91 | 20.08 | 84.27 | 32.87 |
| PyTorch FP16 | 1 | 29.05 | 19.35 | 95.23 | 33.38 |
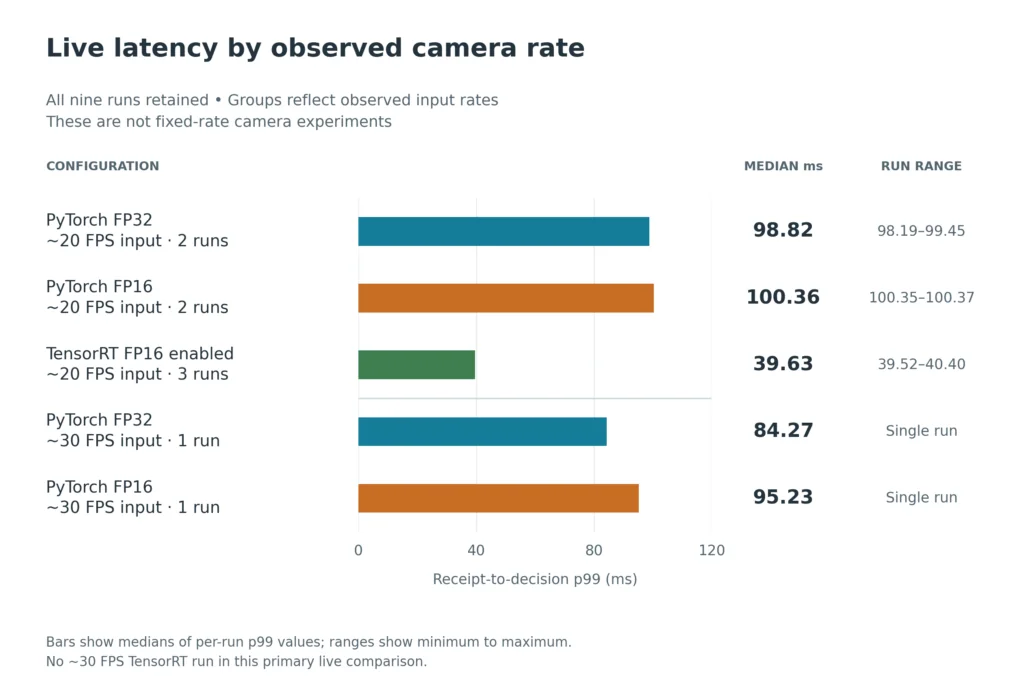
At approximately 20 FPS input, TensorRT processed every valid offered frame, while PyTorch processed nearly all of them. Yet their latency distributions differed substantially: the TensorRT median per-run p99 was 39.63 ms, against 98.82 ms for FP32 and 100.36 ms for FP16 in those groups.
The faster-input PyTorch runs received 29.91 and 29.05 FPS but processed 20.08 and 19.35 FPS, respectively, discarding about a third of offered frames. That is consistent with input outpacing processing. There was no equivalent approximately 30 FPS TensorRT run in this main three-backend comparison. Separate TensorRT diagnostic runs did approach that input rate, as described below.
Detection output agreement
The quality check used 240 sampled frames from one short, unlabelled walking clip. Person detections were matched against PyTorch FP32 using same-class, one-to-one matching with intersection over union (IoU) of at least 0.50.
| Candidate versus PyTorch FP32 | Frames with matched detection sets | Unmatched candidate / reference detections | Matched box IoU, p50 / p95 | Absolute confidence difference, p50 / p95 |
| PyTorch FP16 | 240/240 | 0 / 0 | 0.9984 / 0.9993 | 0.00019 / 0.00050 |
| TensorRT (FP16 enabled) | 240/240 | 0 / 0 | 0.9993 / 0.9997 | 0.00025 / 0.00074 |
All 210 reference person detections matched in both candidates, with no person/no-person changes. The box and confidence differences were small on this set. Agreement with a reference runtime on temporally related frames is not ground-truth accuracy, mAP or proof that accuracy will be preserved in other scenes.
Where the time went
Three additional 300-second TensorRT runs added stage timestamps, completing 5,981–8,857 decisions each. Three control runs used the minimally instrumented path.
One instrumented run received and processed 29.52 FPS with zero application discards and a receipt-to-decision p99 of 40.04 ms. A second received and processed 28.59 FPS, also with zero application discards, at 40.35 ms p99. These observations show TensorRT keeping up with those higher arrival rates during the diagnostic tests. They remain separate from the main comparison because instrumentation and observed input rates differed; they do not establish a controlled, fixed-30-FPS comparison across backends.
The following values are unweighted means of the three instrumented run means.
| Host-timed stage | Mean elapsed time, ms |
| Compressed-buffer copy and application queue wait | 0.48 |
| JPEG decode and BGR conversion | 10.00 |
| Resize, padding, transfer and normalization dispatch | 3.30 |
| Queued GPU normalization and forward through output readiness | 12.34 |
| External NMS and CPU-readable detections | 5.82 |
| Complete receipt-to-decision interval | 31.94 |
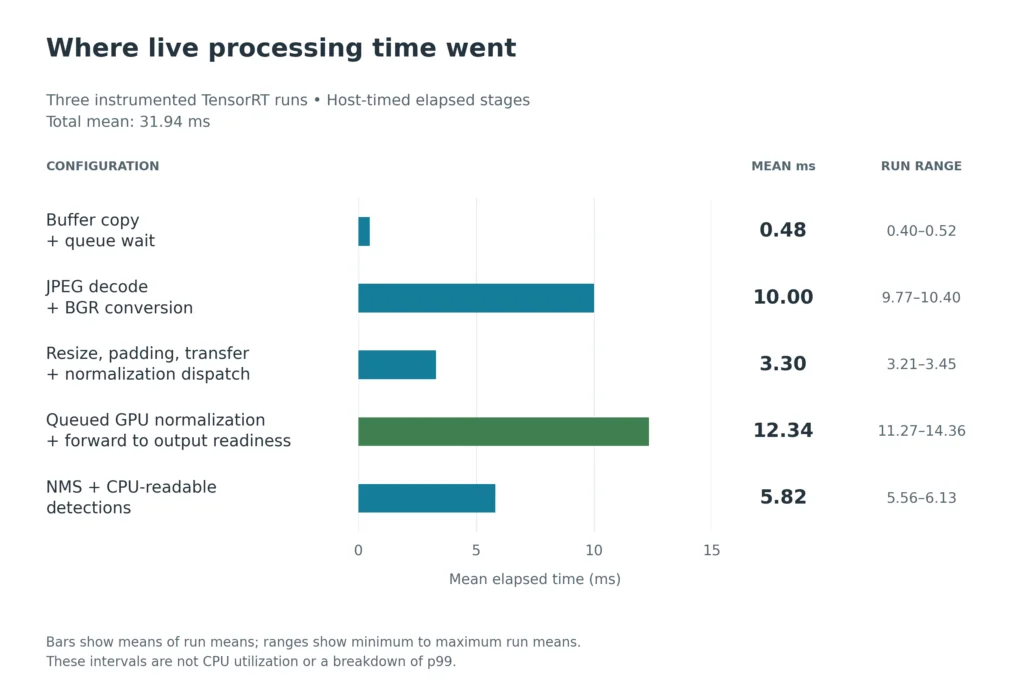
Decode, preparation and postprocessing together account for 19.12 ms, about 60% of that total. Those are host-timed intervals that include transfers and GPU work, not a measurement of pure CPU execution. JPEG decoding alone took about 10 ms. Improving only the model cannot remove these surrounding costs.
The 31.94 ms diagnostic mean, the primary live TensorRT p50 of 36.59 ms and the roughly 26.8 ms per completed replay frame are different statistics from different runs. Replay reads stored frames without a live capture queue; live processing includes capture handling, and diagnostic input rates also varied. The tests do not isolate the contribution of each difference. Their paired controls likewise do not provide a stable instrumentation-overhead estimate.
For this application, decode and postprocessing deserve attention alongside GPU inference. A faster decoder, fewer transfers or a different processing layout would need its own measurement; no gain from those changes is claimed here.
Part 3: Queue policy and frame freshness
When processing falls behind, FIFO preserves arrival order but can make decisions on older frames. A latest-frame slot replaces an older waiting frame with a newer one. Each policy ran three times for 300 seconds with the same TensorRT configuration. A fixed 30.432 ms delay after frame selection and before decode created overload; this delay is not model inference time.
The runs received approximately 19.93 FPS and completed 4,282–4,290 decisions during their timed windows. Remaining queued frames were accounted for after input stopped.
| Queue policy | Receipt-to-decision p50 / p99, ms | Processed FPS | Application discards, % |
| FIFO, eight waiting frames | 604.62 [603.99–605.19] / 639.73 [638.22–640.07] | 14.28 [14.27–14.30] | 28.21 [28.14–28.26] |
| Latest-frame slot, one waiting frame | 95.26 [95.02–95.28] / 121.78 [121.78–121.84] | 14.28 [14.27–14.28] | 28.36 [28.34–28.37] |
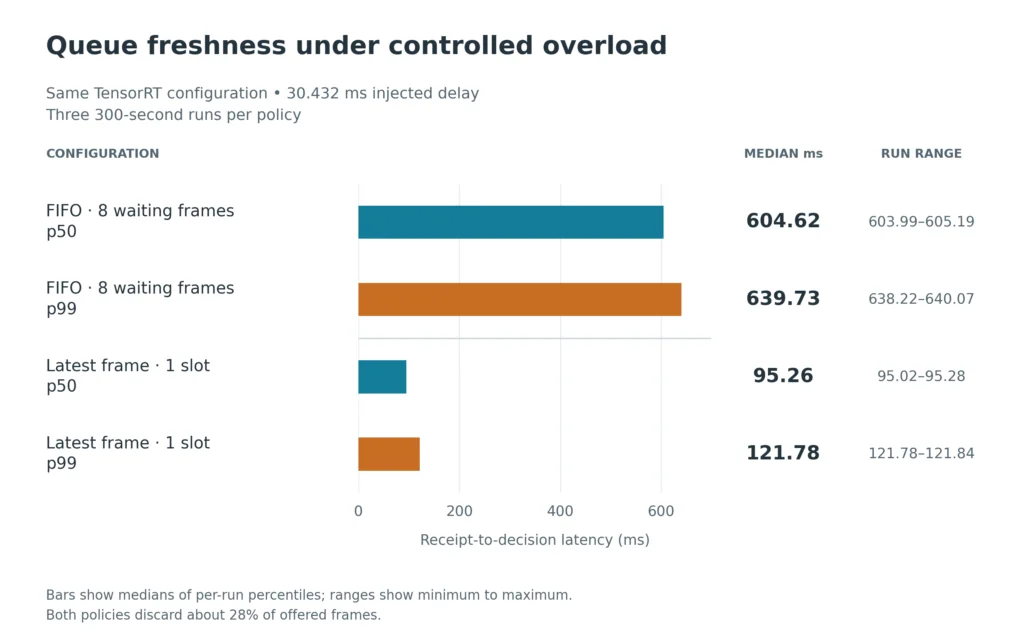
Both policies processed about 14.28 FPS and discarded roughly 28% of offered frames. The latest-frame slot lowered median per-run p99 from 639.73 ms to 121.78 ms. Similar FPS therefore concealed a large difference in how old a frame was when its decision arrived.
For an application that needs the freshest available view, the latest-frame policy is the stronger fit in this test. Short-event recall was not measured, so that freshness result does not establish better event coverage.
Part 4: Supporting-service placement and sustained operation
A light service can share the Jetson in this workload
Installing a Jetson on Turing Pi 2.5 does not change its GPU. The board instead makes another node available for supporting work. We compared a synthetic JSON event-ingest service on the Jetson with the same service on an RK1. A second RK1 generated a fixed workload over wired Ethernet.
The service used a bounded in-memory ring and deterministic aggregate queries. The load was 20 requests per second, with 256-byte payloads and a 20% query share. Live detections did not drive it, keeping the offered service work identical across placements.
Each condition ran three times for 600 seconds, with 11,961 vision decisions per run. Each service run offered and completed 12,000 requests. The vision-only condition ran no service.
| Placement | Vision p99, ms | Vision FPS | Service request p50 / p99, ms | Failed service requests |
| Vision only | 39.53 [39.32–39.66] | 19.93 [19.93–19.93] | Not running | Not applicable |
| Service on Jetson | 39.76 [39.69–39.88] | 19.93 [19.93–19.93] | 2.34 [2.34–2.38] / 5.73 [5.42–6.09] | 0 |
| Service on RK1 | 39.33 [39.29–39.41] | 19.93 [19.93–19.93] | 1.79 [1.57–2.34] / 5.20 [3.78–6.46] | 0 |
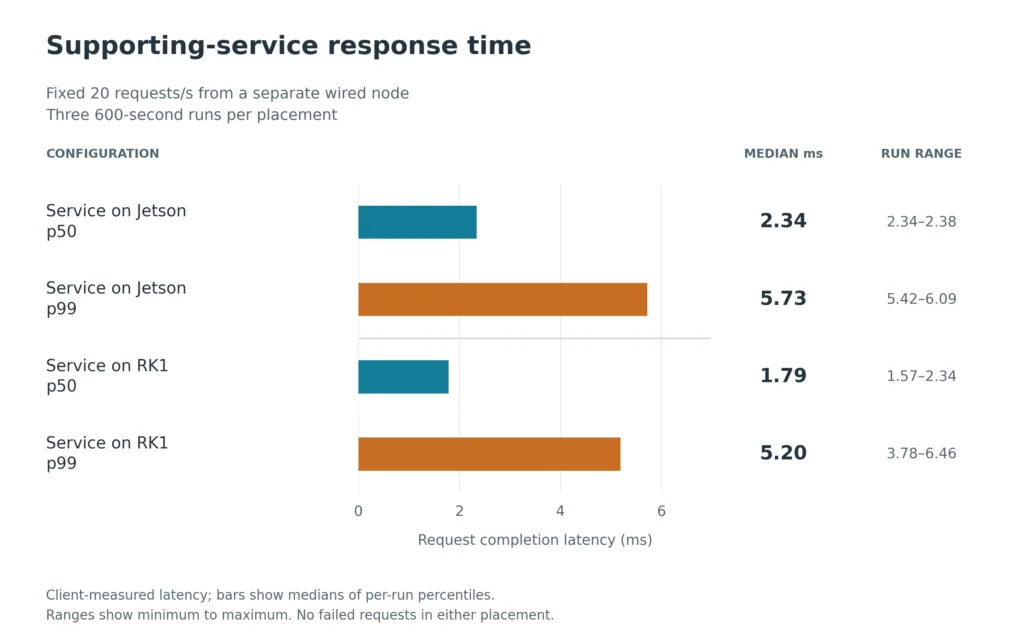
This light service shared the Jetson without a throughput loss; median vision p99 stayed within 0.5 ms across placements. No application frames were discarded. Moving it to RK1 produced no substantial vision-performance advantage at this load. That does not establish equivalence, and heavier service loads, database writes and other workloads were not tested.
The practical board benefit here is placement flexibility. These results do not justify adding another node solely to accelerate this particular vision workload.
One hour of camera operation
One continuous 60-minute run used the actual Brio camera, TensorRT and a latest-frame queue, with the preview stopped. Across twelve five-minute windows, throughput ranged from 19.91 to 19.94 FPS. The first and last ten-minute receipt-window p99 values were 39.70 and 39.60 ms.
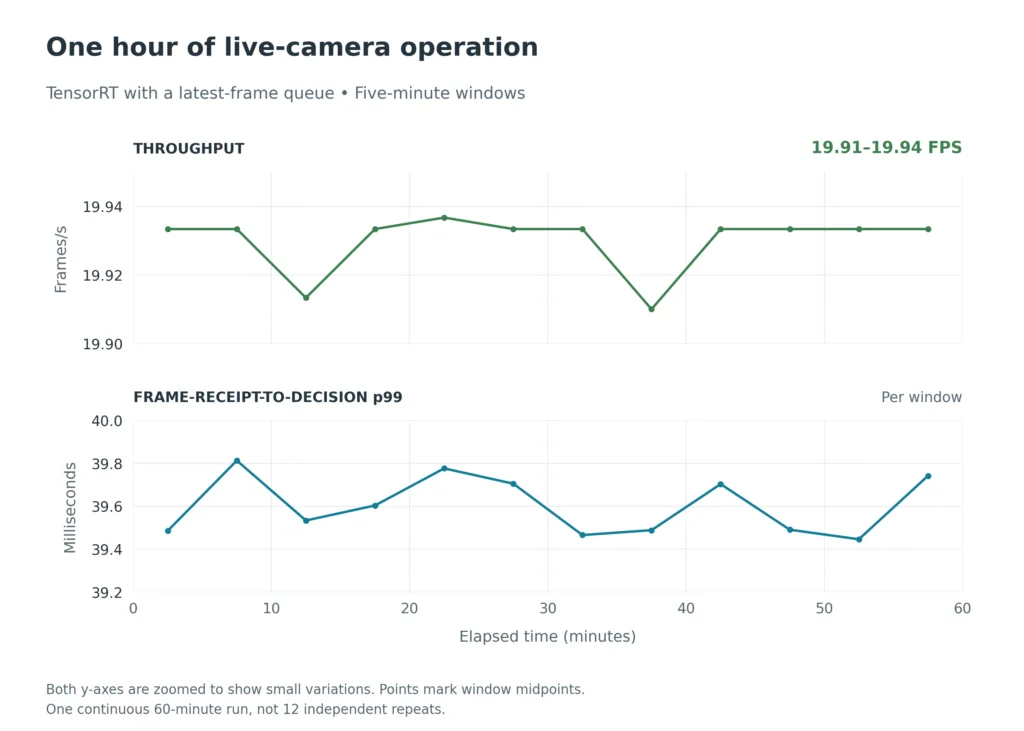
The run recorded 71,755 valid offered frames and completed 71,749 decisions. Six frames were replaced in the application queue, a discard rate of 0.00836%. There were seven V4L2 sequence gaps, no capture or processing errors and no outstanding work. GPU temperature ranged from 60.8 to 62.5 °C. The room lights were reported on; illuminance was not measured.
System RAM’s first-to-last ten-minute median rose from 3,723 to 3,959 MB, an increase of 236 MB. The application retained per-frame timing and detection records until the run ended, so this was not a bounded-memory deployment test. System-wide readings cannot assign the entire increase to those records. A brief trace-file copy overlapped the soak without recorded timing or volume, and GPU and EMC frequency readings were unavailable. The run demonstrates sustained observed throughput and latency under these conditions, not a clean isolation of thermal or memory behavior.
Troubleshooting
These issues were observed in the setup, pilot runs or measured camera behavior. Failed pilots were corrected before the reported comparisons.
| Symptom | What the evidence showed | Practical response |
| A negotiated 30 FPS camera delivers fewer or varying frames | Actual arrival cadence varied while exposure-driven frame-rate control was enabled | Check arrival timestamps, lighting and exposure settings before treating the configured FPS as the offered load |
| FP16 inference fails with an input/bias type mismatch | A pilot passed float32 input to float16 weights | Match the input tensor dtype to the selected runtime and verify a forward pass |
| Camera mode restoration reports “device busy” | A pilot tried restoring the mode before releasing its memory-mapped buffers | Release capture buffers before restoring the previous camera mode |
| The application cannot import PyTorch | A launcher selected a different Python environment | Use the environment containing the verified GPU runtime |
What You’ve Built
The measured system combines a YOLO11n detector on Jetson, an explicit queue policy and optional service placement on another Turing Pi node. TensorRT improved serial replay throughput, while the live and overload tests showed why FPS alone is an incomplete measure of responsiveness.
What to change first depends on where time is spent:
- Old decisions under overload: inspect queue age and use a latest-frame policy when freshness matters more than processing every offered frame.
- Decode or processing around the model dominates: examine JPEG decoding, transfers and NMS before expecting another model-runtime change to solve the whole delay.
- Supporting work competes for resources: measure that workload locally before moving it. The tested light service did not need offload to maintain vision throughput.
Related Articles
- NVIDIA Jetson Software Stack: how the runtimes fit the platform.
- Docker, GPU Containers and NVMe: preparing the node and persistent storage.
- Frigate on Jetson Orin Nano: object detection inside a camera application.
- Distributed ROS 2 on Turing Pi 2.5: moving images and detections between nodes.
- Jetson Dev Kit versus Turing Pi 2.5: the broader deployment comparison.
FAQ
Which FPS number should I compare?
Compare serial replay FPS with tests using one frame in flight and the same processing stages. Live processed FPS also depends on camera arrival cadence and queue behavior. GPU inference time excludes the rest of the application path.
Does faster GPU inference mean proportionally faster camera decisions?
No. Frame handling, JPEG decoding, preprocessing, postprocessing and queue wait remain. TensorRT’s 7.99 ms replay GPU median is not the latency of the complete camera application.
Does output agreement mean the detector is accurate?
No. The short walking set had no ground-truth labels. It measured agreement with PyTorch FP32, not accuracy or mAP.
Does this service need NVMe on RK1?
No. The measured service used a bounded in-memory ring. NVMe on the Jetson stored the benchmark data.