
Your k3s cluster is running. GitOps is deploying changes automatically. Networking is sorted with MetalLB and Cloudflare Tunnel. But if something breaks on your Turing Pi RK1 cluster, you still find out the way most homelabs do: a service stops responding, and you start digging through kubectl describe output with no idea when the problem started or how long it has been building.
You have no visibility into CPU pressure, memory saturation, pod restarts, node health, or storage utilization until one of them becomes a problem. That’s the gap every production cluster closes with a monitoring stack, and it’s the gap most homelabs skip.
Prometheus continuously collects metrics from your cluster and stores them as time series. Grafana turns that data into dashboards you can read at a glance. Instead of investigating after a node runs out of memory or a pod starts repeatedly crashing, you can see the pressure building and track exactly when the behavior changed.
In this guide, you’ll deploy the full kube-prometheus-stack on your RK1 cluster using Helm. The stack bundles Prometheus, Grafana, Alertmanager, node-exporter, and kube-state-metrics into one installation. You’ll persist Prometheus metrics on Longhorn, explore cluster and per-node dashboards, track pod and storage health, and import a Longhorn-specific Grafana dashboard.
By the end, you’ll have a monitoring layer for the cluster you’ve been building throughout this series: real-time visibility into all RK1 nodes and enough historical data to spot problems before a service simply stops responding.
Part 1: What You’re Actually Installing
kube-prometheus-stack isn’t a single application. It’s a collection of monitoring components that work together to collect, store, visualize, and alert on what’s happening inside your cluster. Before installing anything, it’s worth understanding the role each component plays.
Prometheus is the metrics database at the center of the stack. It continuously scrapes metrics endpoints across your cluster, stores the results as time series, and makes them available through PromQL. Every dashboard and alert you’ll build later ultimately starts with data collected by Prometheus.
Grafana is the visualization layer. It queries Prometheus and turns raw metrics into dashboards that are much easier to understand. The chart comes preloaded with Kubernetes dashboards, so you can start exploring your cluster immediately instead of building panels from scratch.
Alertmanager handles notifications. Prometheus evaluates alert rules, but Alertmanager decides what happens next: sending alerts to Slack, email, webhooks, or whatever notification system you configure. Later in this guide, you’ll create a simple memory pressure alert and verify that Alertmanager is ready to process it.
node-exporter runs as a DaemonSet, meaning one pod is deployed on every RK1 node. It exposes host-level metrics directly from Linux, including CPU utilization, memory usage, disk activity, filesystem usage, and network traffic. These are the metrics you’ll use to understand how each physical node is performing.
kube-state-metrics complements node-exporter by exposing the state of Kubernetes objects instead of the underlying operating system. It reports information about deployments, pods, StatefulSets, PersistentVolumeClaims, replica counts, and much more, helping answer questions like “Is my deployment healthy?” rather than “Is my server healthy?”
You could install each component separately, but that’s rarely worth the effort. kube-prometheus-stack is the standard deployment for Kubernetes because it wires everything together automatically: Prometheus discovers scrape targets through ServiceMonitors, Grafana is preconfigured to use Prometheus as its data source, Alertmanager integrates with Prometheus out of the box, and the chart includes a curated set of dashboards and monitoring rules. Instead of stitching together five independent projects, you get a monitoring stack that’s ready to use with a single Helm installation.
Part 2: Prerequisites and Storage Considerations
Before continuing, make sure Helm is installed and configured to communicate with your k3s cluster. You’ll also need a Kubernetes StorageClass for Prometheus to store its metrics. If you’ve already followed the Kubernetes storage guide in this series, Longhorn is the natural choice. It provides replicated persistent volumes with dynamic provisioning, so Prometheus can request storage automatically without any manual volume creation.
Unlike most applications in your cluster, Prometheus becomes more valuable over time. Every metric it collects is stored so you can compare what’s happening now with what happened minutes, hours, or days ago. If Prometheus restarts without persistent storage, that history disappears, making it impossible to investigate trends like gradually increasing memory usage, recurring pod restarts, or storage consumption over time.
The default retention period in kube-prometheus-stack is 10 days, and storage requirements scale primarily with three factors: how many metrics are being collected, how frequently Prometheus scrapes them, and how long you choose to retain the data. Prometheus compresses time-series data efficiently, but you’ll still want enough free space for indexing and background compaction.
For a typical homelab running the default Kubernetes exporters and a handful of self-hosted applications, allocating a 15Gi PersistentVolumeClaim for Prometheus provides plenty of headroom while remaining modest enough for Longhorn-backed storage. Grafana and Alertmanager store very little data by comparison, so 2Gi volumes for each are more than sufficient for most homelab deployments.
Part 3: Install kube-prometheus-stack via Helm
Start by adding the Prometheus Community Helm repository and creating a dedicated namespace for the monitoring stack:
helm repo add prometheus-community https://prometheus-community.github.io/helm-charts
helm repo update
kubectl create namespace monitoring
Next, create a values.yaml file. Rather than installing the chart completely unmodified, we’ll configure persistent storage and set conservative resource requests that are better suited to an RK1-based homelab.
# values.yaml

grafana:
  adminUser: admin
  persistence:
    enabled: true
    storageClassName: longhorn
    size: 2Gi
  resources:
    requests:
      cpu: 50m
      memory: 256Mi
    limits:
      cpu: 200m
      memory: 512Mi

alertmanager:
  alertmanagerSpec:
    storage:
      volumeClaimTemplate:
        spec:
          storageClassName: longhorn
          accessModes:
            - ReadWriteOnce
          resources:
            requests:
              storage: 2Gi
    resources:
      requests:
        cpu: 25m
        memory: 64Mi
      limits:
        cpu: 100m
        memory: 128Mi

prometheus:
  prometheusSpec:
    retention: 10d
    storageSpec:
      volumeClaimTemplate:
        spec:
          storageClassName: longhorn
          accessModes:
            - ReadWriteOnce
          resources:
            requests:
              storage: 15Gi
    resources:
      requests:
        cpu: 200m
        memory: 512Mi
      limits:
        cpu: 500m
        memory: 1Gi

prometheus-node-exporter:
  resources:
    requests:
      cpu: 25m
      memory: 16Mi
    limits:
      cpu: 100m
      memory: 64Mi

kube-state-metrics:
  resources:
    requests:
      cpu: 25m
      memory: 32Mi
    limits:
      cpu: 100m
      memory: 64Mi
Every persistent component is configured to use the longhorn StorageClass, ensuring that Prometheus, Grafana, and Alertmanager retain their data across pod restarts. If your cluster uses a different StorageClass, replace longhorn with the appropriate name before installing the chart.
The resource requests and limits above are based on validation on our three-node Turing Pi RK1 cluster running Kubernetes v1.36 with Longhorn storage. After the monitoring stack stabilized, Prometheus used approximately 352 MiB, Grafana 311 MiB, Alertmanager 25 MiB, kube-state-metrics 18 MiB, and each node-exporter pod 8–9 MiB of memory under idle conditions. These values provide a practical starting point for small ARM64 homelabs while leaving headroom for additional workloads. As your cluster grows, monitor actual resource usage and adjust these settings to match your scrape targets, retention period, and workload.
Install the chart:
helm install prometheus-stack prometheus-community/kube-prometheus-stack \
  --namespace monitoring \
  --values values.yaml
The initial deployment usually takes a minute or two while Kubernetes pulls container images and provisions persistent volumes.
Once the installation completes, verify that every component is running:
kubectl get pods -n monitoring
You should see the Prometheus Operator, Prometheus, Grafana, Alertmanager, one node-exporter pod on each node, and kube-state-metrics, all in the Running state before continuing.
Part 4: Access Grafana
The quickest way to access Grafana is by using kubectl port-forward, which creates a temporary connection to the Grafana service without exposing it outside your cluster.
kubectl port-forward -n monitoring svc/prometheus-stack-grafana 3000:80
If you’re running this command directly on the Kubernetes node, open your browser and navigate to http://localhost:3000.
If you’re connected to the node over SSH from another computer, localhost refers to the remote machine rather than your local browser. In that case, reconnect with SSH local port forwarding:
ssh -L 3000:localhost:3000 <user>@<server-ip>
Then run the kubectl port-forward command in that SSH session before opening http://localhost:3000 on your local machine.
The default username is admin. Since the values.yaml file doesn’t specify an adminPassword, the Helm chart automatically generates a random password and stores it in a Kubernetes Secret. Retrieve it with:
kubectl get secret -n monitoring prometheus-stack-grafana \
  -o jsonpath="{.data.admin-password}" | base64 --decode
After signing in, change the password from your Grafana profile for easier future access.
The kube-prometheus-stack chart automatically provisions Prometheus and Alertmanager as data sources and imports a collection of Kubernetes monitoring dashboards. Open Dashboards → Dashboards to browse the available dashboards.
Some of the most useful dashboards to begin with are:
- Kubernetes / Compute Resources / Cluster – A high-level overview of CPU and memory usage across the entire cluster, grouped by namespace.
- Kubernetes / Compute Resources / Node (Pods) – Displays resource consumption for every pod running on a selected node, making it useful for identifying resource-heavy workloads.
- Kubernetes / Nodes Overview – Shows overall node health, including CPU, memory, filesystem, and network utilization.
- Kubernetes / Persistent Volumes – Monitors Persistent Volume Claims, storage capacity, and utilization, making it useful for tracking Longhorn-backed volumes.
Immediately after installation, some dashboards may appear sparse because Prometheus has only just started scraping metrics. After a few minutes, the graphs will begin filling with historical data and provide a much clearer view of your cluster’s health.
Part 5: Generate a Test Workload
A freshly installed Kubernetes cluster is mostly idle, so many of the dashboards will show little activity. Before exploring them, deploy a temporary workload that generates CPU and memory usage so you can watch the metrics update in real time.
The following deployment runs stress-ng for ten minutes, allocating approximately 2 GB of memory while placing load on four CPU cores:
apiVersion: apps/v1
kind: Deployment
metadata:
  name: stress-ng
spec:
  replicas: 1
  selector:
    matchLabels:
      app: stress-ng
  template:
    metadata:
      labels:
        app: stress-ng
    spec:
      containers:
        - name: stress-ng
          image: ghcr.io/colinianking/stress-ng:latest
          args:
            - "--vm"
            - "1"
            - "--vm-bytes"
            - "2G"
            - "--cpu"
            - "4"
            - "--timeout"
            - "10m"
Apply the deployment:
kubectl apply -f stress-ng.yaml
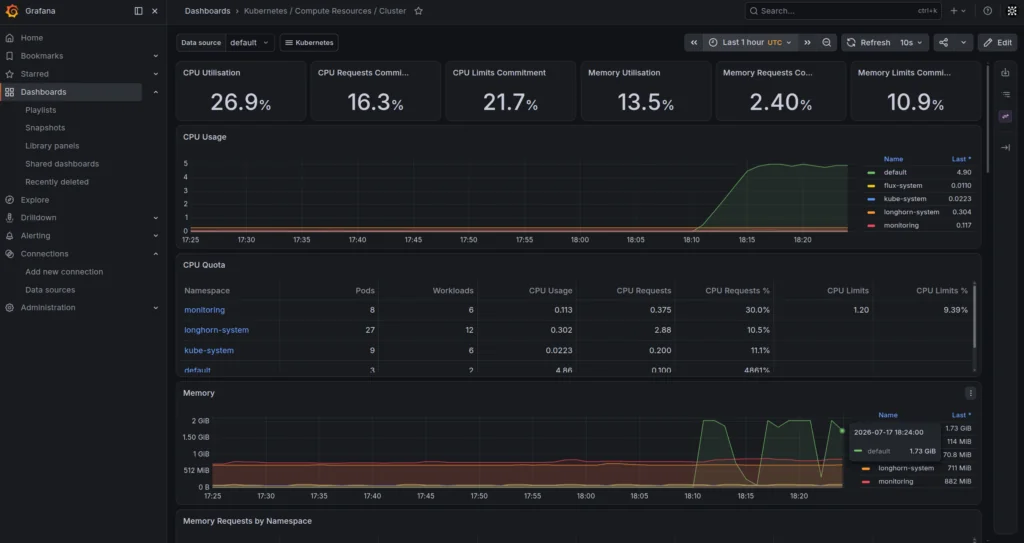
Within a minute or two, Prometheus will begin collecting metrics from the new workload. As you work through the dashboards in the next section, you should see CPU utilization, memory consumption, and pod resource usage increase before returning to normal once the test completes.
When you’re finished, remove the workload:
kubectl delete -f stress-ng.yaml
Part 6: Explore Your Cluster Metrics
With the monitoring stack running, Grafana begins collecting metrics from every node and workload in your cluster. Open Dashboards → Dashboards and start with Kubernetes / Nodes Overview. This dashboard provides a quick snapshot of your cluster’s overall health, including CPU utilization, memory usage, filesystem capacity, and network traffic for each node.
Next, open Kubernetes / Compute Resources / Cluster. This dashboard breaks resource usage down by namespace, making it easy to identify which applications are consuming the most CPU and memory. If a particular namespace suddenly begins using significantly more resources than expected, you’ll spot it here long before the node itself becomes overloaded.
To investigate a specific machine, switch to Kubernetes / Compute Resources / Node (Pods). Select one of your RK1 nodes using the dashboard variables at the top, then review which pods are consuming the most resources. This is one of the quickest ways to identify noisy workloads, uneven scheduling, or pods that are using considerably more memory than expected.
Storage metrics are available through Kubernetes / Persistent Volumes, where you can monitor Persistent Volume Claim capacity and utilization. Since this guide uses Longhorn for persistent storage, these dashboards provide an easy way to track how much space your monitoring stack and other stateful workloads are consuming over time.
As Prometheus continues scraping your cluster, the dashboards become increasingly valuable. Initially, you’ll only have a few minutes of history, but over time you’ll build a detailed view of resource usage, workload behavior, and long-term trends. Instead of reacting when a service fails, you’ll often be able to spot growing resource usage, abnormal traffic patterns, or storage pressure before they become production issues.
Part 7: Import an Additional Dashboard
The dashboards bundled with kube-prometheus-stack provide excellent visibility into Kubernetes itself, but they don’t cover every application running in your cluster. Many projects publish their own Grafana dashboards, making it easy to visualize application-specific metrics without building dashboards from scratch.
Longhorn is a good example. While the built-in Kubernetes dashboards show Persistent Volume usage, they don’t expose storage-specific metrics such as replica health, rebuild activity, per-volume throughput, or IOPS.
To import a community dashboard, open Dashboards → New → Import, enter dashboard ID 22705 (“Longhorn Dashboard”), and click Load. When prompted, select your existing Prometheus data source and complete the import.
Once imported, you’ll have a dedicated dashboard for monitoring your Longhorn deployment alongside the Kubernetes dashboards you’ve already explored. Together, they provide a much more complete picture of your cluster’s storage health and performance.
The same approach applies to many other tools in a self-hosted Kubernetes cluster. Before creating custom dashboards, check whether the project already provides one. Popular applications such as PostgreSQL, Redis, Traefik, Cilium, Loki, and many others have community-maintained Grafana dashboards that can usually be imported in just a few clicks.
Part 8: Create Your First Alert
Collecting metrics is only half of the monitoring story. The next step is turning those metrics into alerts that notify you when something requires attention.
With the Prometheus Operator, alert rules are defined using the PrometheusRule custom resource. Prometheus continuously evaluates these rules, and when a condition remains true for the configured duration, it sends the alert to Alertmanager for routing and notification.
The following example creates a warning if any Kubernetes node exceeds 85% memory utilization for more than five minutes:
# node-memory-alert.yaml

apiVersion: monitoring.coreos.com/v1
kind: PrometheusRule
metadata:
  name: node-memory-alerts
  namespace: monitoring
  labels:
    release: prometheus-stack
spec:
  groups:
    - name: node-memory
      rules:
        - alert: NodeMemoryHighUtilization
          expr: |
            100 - (node_memory_MemAvailable_bytes / node_memory_MemTotal_bytes * 100) > 85
          for: 5m
          labels:
            severity: warning
          annotations:
            summary: "High memory usage on {{ $labels.instance }}"
            description: "Memory usage on {{ $labels.instance }} has been above 85% for more than 5 minutes."
The release: prometheus-stack label is important because it must match the Helm release name used when installing kube-prometheus-stack. Otherwise, the Prometheus Operator won’t discover and load the rule.
Apply the rule:
kubectl apply -f node-memory-alert.yaml
To confirm that Prometheus has loaded the rule, temporarily port-forward the Prometheus service:
kubectl port-forward -n monitoring \
  svc/prometheus-stack-kube-prom-prometheus 9090:9090
If you’re running this command directly on the Kubernetes node, open your browser and navigate to http://localhost:9090.
If you’re connected to the node over SSH from another computer, localhost refers to the remote machine rather than your local browser. Reconnect with SSH local port forwarding:
ssh -L 9090:localhost:9090 <user>@<server-ip>
Then run the kubectl port-forward command in that SSH session before opening http://localhost:9090 on your local machine.
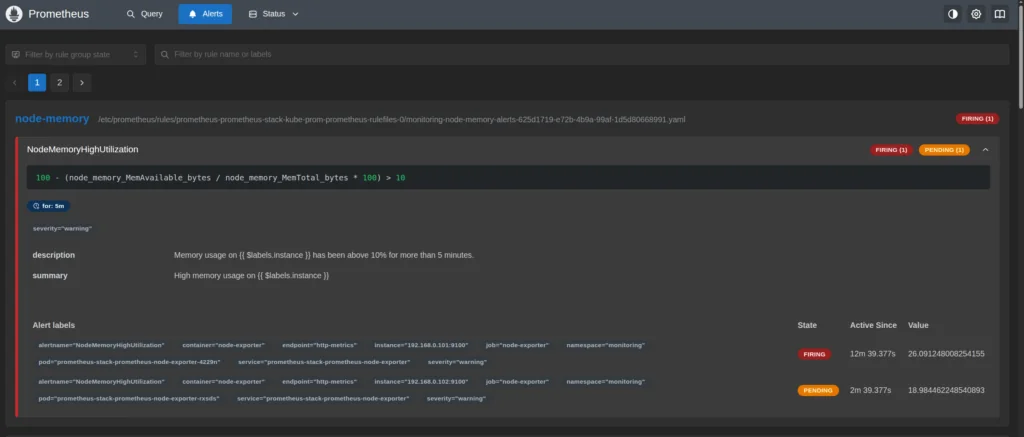
Open the Alerts page in the Prometheus UI and verify that the NodeMemoryHighUtilization rule appears. If the rule’s condition is met, it will first enter the Pending state. After the condition has remained true for the configured for duration (five minutes in this example), the alert transitions to Firing and is sent to Alertmanager.
For testing, temporarily lower the threshold from > 85 to a value such as > 10. This should cause the alert to enter the Pending state almost immediately. After confirming that the rule is evaluated correctly, restore the threshold to a value appropriate for your environment.
Troubleshooting
Prometheus pods remain in Pending after installation.
This usually means the PersistentVolumeClaims can’t be bound. Verify that the storageClassName values in your values.yaml match a StorageClass available in your cluster:
kubectl get storageclass
If they don’t match, update values.yaml and run helm upgrade again.
Grafana dashboards show “No data”.
Immediately after installation, Prometheus hasn’t collected enough metrics to populate every dashboard. Wait a few minutes, then refresh Grafana. Some panels, particularly those showing rates over time, require multiple scrapes before data appears.
Custom alert rules don’t appear in Prometheus.
Make sure the PrometheusRule resource is in the monitoring namespace and that its release label matches the Helm release name used when installing kube-prometheus-stack (for example, release: prometheus-stack). You can confirm the rule has been loaded from the Alerts page in the Prometheus UI.
kubectl port-forward disconnects unexpectedly.
Port forwarding only remains active while the terminal session is running. If the command exits or your SSH session disconnects, restart the kubectl port-forward command before reconnecting to Grafana or Prometheus.
What You’ve Built
By following this guide, you’ve deployed a production-ready monitoring stack on your Turing Pi cluster. Prometheus continuously collects metrics from Kubernetes and your nodes, Grafana visualizes them through built-in and community dashboards, and Alertmanager is ready to process alerts as you begin adding notification receivers.
You also learned how to validate the stack by generating a real workload, explore cluster health through Grafana, and create your first Prometheus alert rule. With these pieces in place, you have a solid foundation for monitoring both your Kubernetes infrastructure and the applications you deploy in the future.
If you want to securely access Grafana from outside your home network, or expose other services running on your cluster, you can build on this setup using a Cloudflare Tunnel as covered in our dedicated guide.
Related Articles
- Turing Pi 2.5 / RK1 Complete Setup Guide: Start here if you haven’t already built your Kubernetes cluster. This guide covers everything from unboxing the hardware to deploying a working k3s cluster.
- Deploy Gitea on Turing Pi: Set up a lightweight self-hosted Git server and monitor its performance using the Prometheus and Grafana stack from this guide.
- Automate Your Turing Pi Cluster with Ansible: Automate deployments, updates, and routine maintenance tasks while using your monitoring stack to verify changes.
- k3s vs K0s vs MicroK8s vs RKE2: Compare lightweight Kubernetes distributions and learn why this series uses k3s as its foundation.
- Flannel vs Cilium vs Calico on k3s: Understand how different Container Network Interfaces (CNIs) affect networking performance and observe their impact using the dashboards you’ve configured in this guide.
FAQ
Does Prometheus work on ARM64?
Yes. Prometheus, Alertmanager, Grafana, node-exporter, and kube-state-metrics all publish official multi-architecture images that include linux/arm64. They run natively on RK1 and other ARM64 platforms without requiring community-maintained images or workarounds.
What is the difference between Prometheus and Grafana?
Prometheus collects, stores, and queries metrics as time series using PromQL. Grafana doesn’t store metrics itself. It queries Prometheus and presents the results through dashboards. In short, Prometheus provides the data, while Grafana provides the visualization.
How much storage does Prometheus need on a homelab cluster?
For most small homelab clusters, a 15Gi PersistentVolume with 10-day retention provides plenty of room for Prometheus while leaving headroom as you add more workloads and scrape targets. If you significantly increase retention or monitor many additional services, consider increasing the volume size accordingly.
Does kube-prometheus-stack work with k3s?
Yes. kube-prometheus-stack works well with k3s, but it’s recommended to configure explicit resource requests and limits for ARM-based homelab hardware. You’ll also need to set the correct storageClassName for your cluster, such as Longhorn if you’re following this series.
What is kube-state-metrics?
kube-state-metrics watches the Kubernetes API and exposes the state of Kubernetes objects as Prometheus metrics, including Deployments, Pods, StatefulSets, and PersistentVolumeClaims. Unlike node-exporter, it reports on Kubernetes resources rather than the underlying host.
Can I use Grafana without Prometheus?
Yes. Grafana supports many different data sources, including SQL databases, Loki, InfluxDB, Elasticsearch, and cloud monitoring platforms. In this guide, Grafana is configured to query Prometheus, but it isn’t limited to it.
How do I access Grafana remotely on a homelab?
A common approach is to expose Grafana through a secure reverse tunnel such as Cloudflare Tunnel rather than opening inbound ports on your home network. This lets you access Grafana remotely while keeping your cluster behind your firewall.